One of the benefits of ETW trace files is that they are fully structured. That is to say that they contain well-defined and strongly-typed data payloads, in contrast to raw text log files which only contain message strings. While this makes them slightly harder to read for humans, they are quite amenable to programmatic analysis by computers — no messy string parsing logic needed. This comes in handy in many testing situations, particularly in load testing where appropriately designed ETW traces can be parsed to extract operational latency and throughput data.
To demonstrate this, I have created a new TraceAnalysisSample project. This sample assumes the trace data format from the EventSourceSample. The app reads “request” events to track when operations start and end. It collects the request event count by one second windows (giving basically the per-second throughput) and also gathers percentile data for request latency.
As before, I am using Tx.Windows to read events from an ETL file. In this case, the parser is quite simple, only relying on the activity ID and timestamp of the events (which is provided in the ETW header):
public void OnNext(EtwNativeEvent value)
{
    if (value.ProviderId == SampleProviderId)
    {
        switch (value.Id)
        {
            case 20:
                this.OnStarted(ref value);
                break;
            case 21:
            case 22:
                this.OnCompleted(ref value);
                break;
        }
    }
}

private void OnStarted(ref EtwNativeEvent value)
{
    this.collector.OnStart(1, value.ActivityId, value.TimeStamp.DateTime);
}

private void OnCompleted(ref EtwNativeEvent value)
{
    this.collector.OnEnd(1, value.ActivityId, value.TimeStamp.DateTime);
}
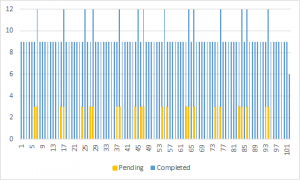
The app runs and produces the window data in CSV format (convenient for graphing in Excel) and prints the latency data at the end. Here is an example:
Window,Pending,Completed
0.000,0,9
1.000,0,9
[ . . . ]
100.000,0,9
101.000,0,6

Latency: P50=0.100, P80=0.100, P95=0.101, P99=0.101, P99.5=0.102
The original EventSourceSample app had an artificial 100 ms delay on the server side, so the data here is exactly as expected. Here is a stacked column chart showing the window (throughput) data:

Keep in mind that this is just one small example of how to use ETW data. There are countless other ways you can mine data from your trace files to enable anything from automatic failure debugging to test coverage analysis.
Pingback: Blogging on logging | WriteAsync .NET