Long ago, I wrote about EventSource, the simple and modern ETW-based tracing solution for .NET 4.5+. Much to the diagnosticians’ delight, EventSource continues to evolve in .NET 4.6. Check out Vance Morrison’s post describing the useful new “rich payload data” feature.
Here is a minimal example showing a new manifest-free way to log such semi-structured data with EventSource.Write<T>:
namespace RichPayloadDataSample
{
    using System;
    using System.Diagnostics.Tracing;
    using System.Threading;
    using System.Threading.Tasks;

    internal sealed class Program
    {
        private static void Main(string[] args)
        {
            using (CancellationTokenSource cts = new CancellationTokenSource())
            {
                Task loop = EventLoop(cts.Token);
                Console.WriteLine("Press ENTER to quit.");
                Console.ReadLine();

                cts.Cancel();
                loop.Wait();
            }
        }

        private static async Task EventLoop(CancellationToken token)
        {
            await Task.Yield();
            MyEventSource myEvents = MyEventSource.Instance;
            int n = 0;
            try
            {
                while (!token.IsCancellationRequested)
                {
                    ++n;
                    Console.WriteLine("[{0}] Iteration {1}.", Thread.CurrentThread.ManagedThreadId, n);

                    myEvents.Write("SomethingGood", new GoodStuff { Name = "X" + n, Number = n });
                    await Task.Delay(500, token);

                    myEvents.Write("SomethingBad", new BadStuff { Name = "Z" + n, Number = -n });
                    await Task.Delay(500, token);
                }
            }
            catch (OperationCanceledException)
            {
            }
        }

        [EventData]
        private sealed class GoodStuff
        {
            public string Name { get; set; }

            public int Number { get; set; }
        }

        [EventData]
        private sealed class BadStuff
        {
            public string Name { get; set; }

            public int Number { get; set; }
        }

        [EventSource(Guid = "554283bf-0ce9-4216-a925-f8629295ba1d")]
        private sealed class MyEventSource : EventSource
        {
            public static readonly MyEventSource Instance = new MyEventSource();

            private MyEventSource()
            {
            }
        }
    }
}
Let’s see what this data looks like in plain old ETL format. Using logman, we can log the events to a file (remember, elevated command prompt):
logman create trace RichPayload -p {554283bf-0ce9-4216-a925-f8629295ba1d} 0xFFFFFFFF 5 -ow -o RichPayload.etl
logman start RichPayload
[ ... at this point, we run the app for a few seconds and quit ... ]
logman stop RichPayload
With tracerpt, we can then decode the traces into EVTX format for easy viewing:
tracerpt -l RichPayload_000001.etl -of evtx -o RichPayload.evtx
Now, open the EVTX file in Event Viewer and look at the event payload in the Details tab, selecting XML View. You will see output like the following:
<Event xmlns="http://schemas.microsoft.com/win/2004/08/events/event">
  <System>
    <Provider Name="MyEventSource" Guid="{554283bf-0ce9-4216-a925-f8629295ba1d}" />
    <EventID>2</EventID>
    <Version>0</Version>
    <Level>5</Level>
    <Task>0</Task>
    <Opcode>0</Opcode>
    <Keywords>0x0</Keywords>
    <TimeCreated SystemTime="2015-09-30T03:41:27.305685200Z" />
    <Correlation ActivityID="{00000000-0000-0000-0000-000000000000}" />
    <Execution ProcessID="7448" ThreadID="14300" ProcessorID="11" KernelTime="0" UserTime="0" />
    <Channel />
    <Computer />
  </System>
  <EventData>
    <Data Name="Name">X1</Data>
    <Data Name="Number">1</Data>
  </EventData>
  <RenderingInfo Culture="en-US">
    <Task>SomethingGood</Task>
  </RenderingInfo>
</Event>
Note the EventData payload which contains the key/value pairs that were logged.
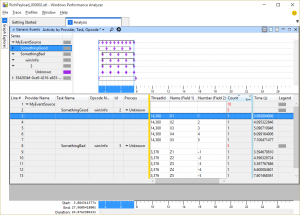
Windows Performance Analyzer is smart enough to decode these events as well. It shows data of this type as generic fields with names derived from the event payload:

Obviously there are pros and cons to manifest-based events and rich data payloads. As Vance points out, performance of rich data is going to be substantially worse when compared to manifest-based events. So don’t go converting all your events to rich data payloads just yet… However, it’s a useful capability to have in your tracing arsenal.