Continuing from our previous performance experiment, I would like to see if there are any easy optimizations to apply to squeeze more throughput out of this producer/consumer queue.
One possible angle of attack is to replace the implicit synchronization primitives with a data structure that already takes care of this aspect for us. As it turns out, BlockingCollection already uses a ConcurrentQueue internally and is highly optimized for the contentious reader/writer pattern we are interested in. Let’s see if the results are more favorable.
Instead of just replacing WorkerQueue outright, we can rename it to WorkerQueue1 and create a new WorkerQueue2 with our new pattern. We should also prepare for easily swapping out implementations by creating an interface IWorkerQueue. Basically we now have this:
    public sealed class WorkerQueue1<T> : IWorkerQueue<T>
    {
        // . . .
    }

    public interface IWorkerQueue<T> : IDisposable
    {
        void Add(T item);
    }
The tests also need an overhaul since they were taking advantage of some implementation details of the synchronization. Here are the revised tests, using the abstract test pattern:
    [TestClass]
    public abstract class WorkerQueueTest
    {
        [TestMethod]
        public void OneThread()
        {
            List<int> received = new List<int>();

            using (IWorkerQueue<int> queue = this.Create(1, (t, i) => received.Add(i + t)))
            {
                for (int i = 0; i < 1000; ++i)
                {
                    queue.Add(i);
                }

                while (received.Count == 0)
                {
                }
            }

            int count = received.Count;
            count.Should().BeGreaterThan(0);
            received.Should().ContainInOrder(Enumerable.Range(0, count));
        }

        [TestMethod]
        public void TwoThreads()
        {
            int sum = 0;

            using (IWorkerQueue<int> queue = this.Create(2, (_, i) => Interlocked.Add(ref sum, i)))
            {
                for (int i = 1; i <= 1000; ++i)
                {
                    queue.Add(i);
                }

                while (Volatile.Read(ref sum) != 500500)
                {
                }
            }

            sum.Should().Be(500500); // 1 + 2 + ... + 999 + 1000
        }

        [TestMethod]
        public void FourThreads()
        {
            int sum = 0;

            using (IWorkerQueue<int> queue = this.Create(4, (_, i) => Interlocked.Add(ref sum, i)))
            {
                for (int i = 1; i <= 1000; ++i)
                {
                    queue.Add(i);
                }

                while (Volatile.Read(ref sum) != 500500)
                {
                }
            }

            sum.Should().Be(500500); // 1 + 2 + ... + 999 + 1000
        }

        [TestMethod]
        public void TwoThreadsOneBlocked()
        {
            List<int> received = new List<int>();
            ManualResetEventSlim block = new ManualResetEventSlim();
            Action<int, int> onReceive = (t, i) =>
            {
                if (t == 0)
                {
                    block.Wait();
                }
                else
                {
                    received.Add(i);
                }
            };

            using (block)
            using (IWorkerQueue<int> queue = this.Create(2, onReceive))
            {
                for (int i = 0; i <= 1000; ++i)
                {
                    queue.Add(i);
                }

                while (received.Count != 1000)
                {
                }

                block.Set();
            }

            // Either 0 or 1 could be consumed by the blocked receiver, but all other
            // values (2 .. 1000) should be read in order by the other receiver.
            received.Should().HaveCount(1000).And.ContainInOrder(Enumerable.Range(2, 999));
        }

        [TestMethod]
        public void TwoThreadsBothBlocked()
        {
            int received = 0;
            ManualResetEventSlim block = new ManualResetEventSlim();
            Action<int, int> onReceive = (t, i) =>
            {
                Interlocked.Add(ref received, i + t);
                block.Wait();
            };

            using (block)
            using (IWorkerQueue<int> queue = this.Create(2, onReceive))
            {
                for (int i = 1; i <= 1000; ++i)
                {
                    queue.Add(i);
                }

                while (Volatile.Read(ref received) != 4)
                {
                }

                block.Set();
            }

            // Should receive at least (1 + 2) + (0 + 1); additional values may be present.
            received.Should().BeGreaterOrEqualTo(4);
        }

        protected abstract IWorkerQueue<int> Create(int threads, Action<int, int> onReceive);
    }
Note the abstract factory method which needs to be implemented by the concrete test classes. Here are those classes now:
    [TestClass]
    public sealed class WorkerQueue1Test : WorkerQueueTest
    {
        protected override IWorkerQueue<int> Create(int threads, Action<int, int> onReceive)
        {
            return new WorkerQueue1<int>(threads, onReceive);
        }
    }

    [TestClass]
    public sealed class WorkerQueue2Test : WorkerQueueTest
    {
        protected override IWorkerQueue<int> Create(int threads, Action<int, int> onReceive)
        {
            return new WorkerQueue2<int>(threads, onReceive);
        }
    }
And finally, the implementation of WorkerQueue2 which ditches the Auto/ManualResetEvent logic and embraces a more modern Task-oriented design:
    using System;
    using System.Collections.Concurrent;
    using System.Threading;
    using System.Threading.Tasks;

    public sealed class WorkerQueue2<T> : IWorkerQueue<T>
    {
        private readonly BlockingCollection<T> queue;
        private readonly Action<int, T> onReceive;
        private readonly CancellationTokenSource cts;
        private readonly Task[] tasks;

        public WorkerQueue2(int threads, Action<int, T> onReceive)
        {
            this.queue = new BlockingCollection<T>();
            this.onReceive = onReceive;
            this.cts = new CancellationTokenSource();
            this.tasks = new Task[threads];

            for (int i = 0; i < threads; ++i)
            {
                int index = i;
                this.tasks[index] = Task.Run(() => this.Receive(index, cts.Token));
            }
        }

        public void Add(T item)
        {
            this.queue.Add(item);
        }

        public void Dispose()
        {
            this.queue.CompleteAdding();
            this.cts.Cancel();
            Task.WaitAll(this.tasks);
            this.cts.Dispose();
            this.queue.Dispose();
        }

        private void Receive(int thread, CancellationToken token)
        {
            try
            {
                while (!token.IsCancellationRequested)
                {
                    if (this.queue.TryTake(out T data, -1, token))
                    {
                        this.onReceive(thread, data);
                    }
                }
            }
            catch (OperationCanceledException)
            {
            }
        }
    }
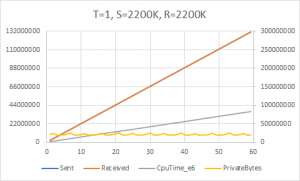
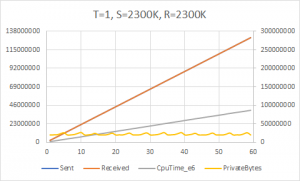
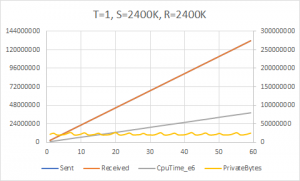
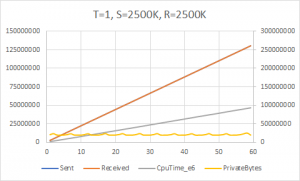
We will again ask our initial performance question: what is the maximum send rate we can achieve without overwhelming the consumer(s)?
Here we can start to see the limits of the accuracy of the throttle. We ostensibly send at a rate of 2200K/sec, 2300K/sec, 2400K/sec, etc. but the maximum throughput achieved is actually around 2220K/sec. The attempt to send at 2600K/sec fails horribly and overwhelms the receiver. So we can conclude that 2200K/sec is the upper bound; this is a full 2.75 times faster than our first cut. Not bad, BlockingCollection!
One more performance question for today: what is the hottest path here? That is, what is contributing to the scalability limit we are hitting? This sounds like a job for the Visual Studio profiler.
First we need to make our application more profiler friendly. Let’s extract a few methods so that we can start a default scenario when zero args are passed:
        private static void Main(string[] args)
        {
            if (args.Length == 0)
            {
                RunProfile();
            }
            else
            {
                RunNormal(args);
            }
        }

        private static void RunProfile()
        {
            Rate rate = Rate.PerSecond(2200000.0d);
            TimeSpan duration = TimeSpan.FromSeconds(10.0d);
            RunQueue(1, rate, rate, duration);
        }

        // . . .
Now we go to the ALT+F2 menu, select “CPU Usage” and off we go. After about 10 seconds, the generated report comes up with these results:
| Function Name | Total CPU [ms, %] | Self CPU [ms, %] | Module |
|---|---|---|---|
| QueuePerf.exe (PID: 11620) | 14685 (100.00%) | 14685 (100.00%) | QueuePerf.exe |
| QueuePerf.WorkerQueue2`1[System.Int64]::Receive | 7976 (54.31%) | 255 (1.74%) | QueuePerf.exe |
| QueuePerf.Operations::Send | 6471 (44.07%) | 567 (3.86%) | QueuePerf.exe |
| [External Call] System.Collections.Concurrent.BlockingCollection`1[System.Int64]::TryTakeWithNoTimeValidation | 4778 (32.54%) | 4778 (32.54%) | Multiple modules |
| QueuePerf.Throttle::Wait | 4054 (27.61%) | 524 (3.57%) | QueuePerf.exe |
| QueuePerf.WorkerQueue2`1[System.Int64]::Add | 3943 (26.85%) | 18 (0.12%) | QueuePerf.exe |
| [External Call] System.Collections.Concurrent.BlockingCollection`1[System.Int64]::TryAddWithNoTimeValidation | 3917 (26.67%) | 3917 (26.67%) | Multiple modules |
| QueuePerf.RealClock::get_Elapsed | 3337 (22.72%) | 75 (0.51%) | QueuePerf.exe |
| [External Call] System.Diagnostics.Stopwatch.GetElapsedDateTimeTicks()$##60030C4 | 3262 (22.21%) | 3262 (22.21%) | Multiple modules |
| QueuePerf.Program+<>c__DisplayClass3_0::<RunQueue>b__0 | 2892 (19.69%) | 796 (5.42%) | QueuePerf.exe |
| [External Call] System.TimeSpan.Subtract(System.TimeSpan)$##6001355 | 123 (0.84%) | 123 (0.84%) | mscorlib.ni.dll |
I’ve highlighted the top three most expensive calls, accounting for exclusive (self) CPU time. Two of them are the expected TryAdd/TryTake methods from BlockingCollection itself. The third is a Stopwatch method which is invoked by the Throttle. It seems that we are wasting quite a bit of time just trying to calculate how long we should wait and rarely ever actually waiting. If I were so inclined, I could act on this valuable data and build a higher performance throttle; for instance, maybe it should more appropriately scale down the frequency of its time calculations as the operation rate goes higher. I’ll save that for another time, but suffice it to say that a profiler is an essential tool when analyzing performance results. Sometimes the measurement methodology itself is part of the bottleneck!
That wraps up today’s investigation. But we haven’t yet seen the last of the WorkerQueue…
Pingback: Even more performance experiments: queues and threads – WriteAsync .NET